Research Summary for August 21, 2001
1.Experimental Data Available:
-
I have contacted with Dr. Sajben about the experimental data
. He sent me two files which include all the experimental data for this
geometry. Experimental data consist of
-
Mean static pressure distributions on the upper and
lower walls for 31 (P_exit/P0_i) ratios. Min(P_exit/P0_i)=0.7166 &
Max(P_exit/P0_i)=0.8624
-
Boundary layer profiles on the model centerline (Z = 0.)
for both top and bottom walls at the inlet (x/h_t = -4.04) and exit (x/h_t
= 8.65) stations. Top-wall profiles for four pressure ratios, bottom-wall
profiles for two. Pressure ratio and total temperature supplied for
each case.
-
Streamwise velocity profiles at different x/h_t stations
for two pressure ratios ( (P_exit/P0_i)=0.81and (P_exit/P0_i)=0.72).
2. Sajben Transonic Diffuser
(STD) Runs:
-
Different runs for the STD geometry were performed by using
two grids:
-
1st grid (fine grid) dimensions: (81 x 51 x2)

Figure 1. Fine grid used in the transonic diffuser computation
-
2nd grid (coarse grid) dimensions: (41 x 26 x2)

Figure 2. Coarse grid used in the transonic diffuser computation
This grid is obtained by reducing the number of fine grid
points in the I and J directions by a factor of 2. (GASP has a grid sequencing
capability.)
-
12 runs for a range of (P_exit/P0_i) ratios were performed
with each grid.
-
P_exit/P0_i ratios are: 0.71, 072, 0.73, 0.74, 0.75, 0.76,
0.77, 0.78, 0.79, 0.80, 0.81, 0.82.
Physical Models Used In the Computation:
-
Inviscid fluxes were calculated by using the upwind biased
3rd order accurate Roe flux scheme.
-
The Min-Mod limiter was used.
-
In the viscous fluxes, the thin-layer approximation was made
for the calculation of the viscous terms. The viscous gradients at the
solid wall were computed by using a second order, one-sided algorithm.
-
Spalart-Allmaras model was used for all the cases.
-
As for the global iteration, Gauss-Seidel time integration
scheme was used. In each cycle, 10 Gauss Seidel inner iterations were performed
with an inner tolerance of 0.01.
-
A constant CFL number based on the freestream values were
used. The value of CFL number was set to 2.0 for the coarse grid and 10.0
for the fine grid. 5000 cycles were performed to obtain the coarse grid
solution. The coarse grid solution was interpolated to the fine grid and
2500 cycles were performed to get the fine grid solution.
-
A fortran code was written for calculating the steady, uniform,
1-D, inviscid flow in this geometry.
Results:
-
Wall Static Pressure Distributions:
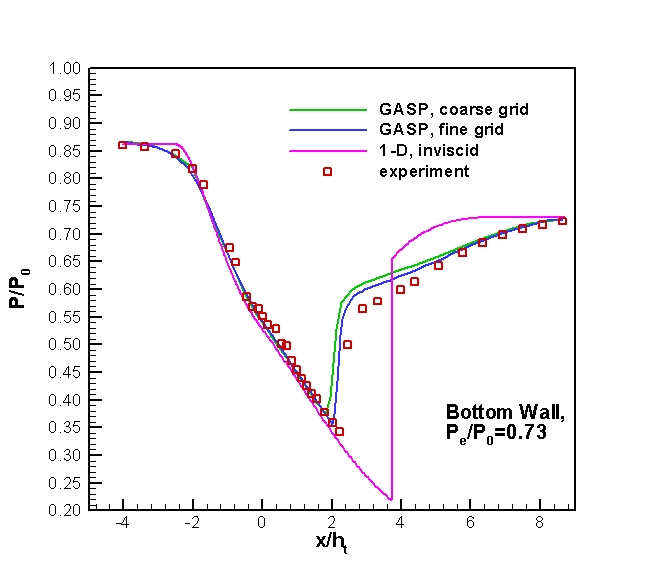
Figure 3. Mean static pressure distribution along the bottom wall of
the diffuser for Pe/P0=0.73..
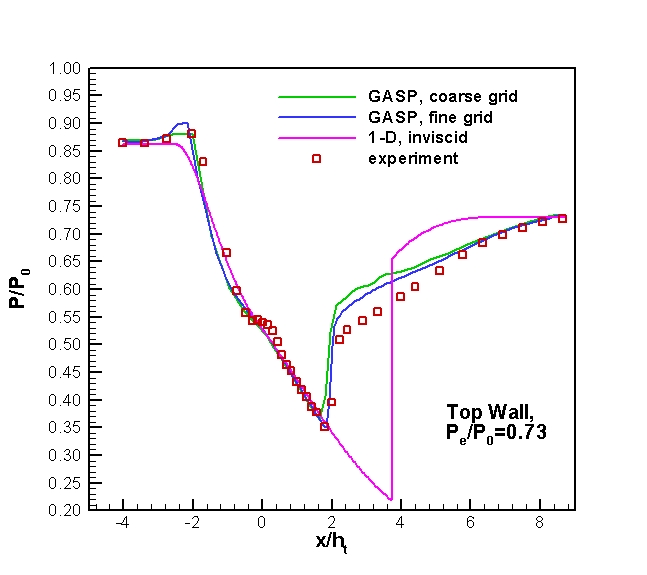
Figure 4. Mean static pressure distribution along the top wall of the
diffuser for Pe/P0=0.73.
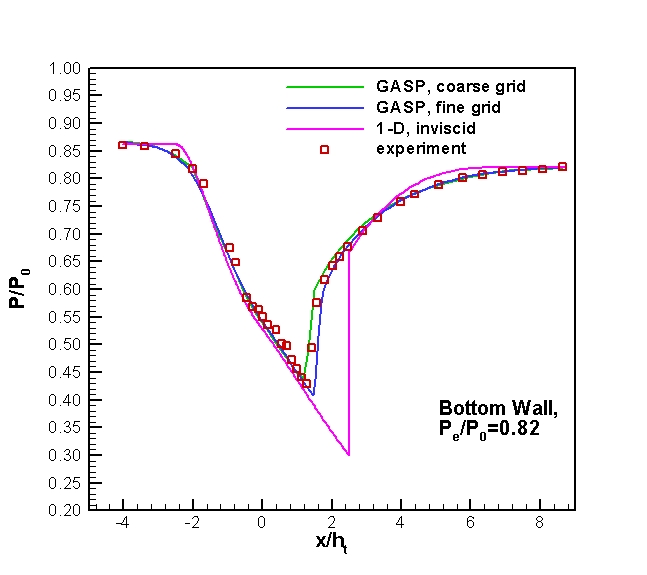
Figure 5. Mean static pressure distribution along the bottom wall of
the diffuser for Pe/P0=0.82.
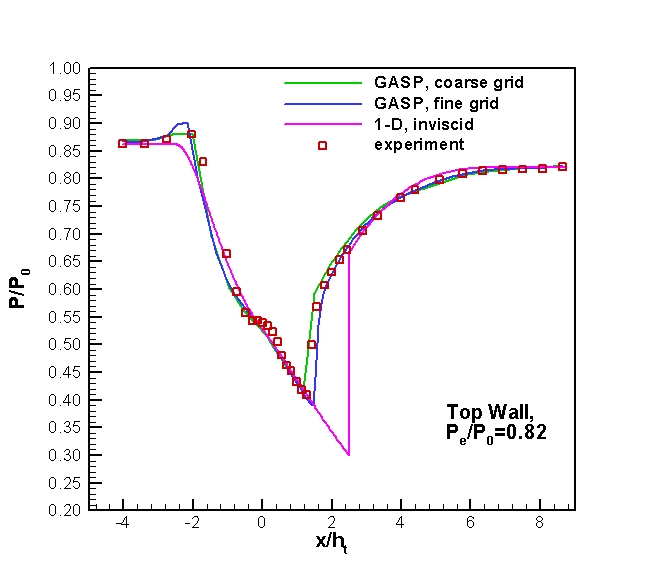
Figure 6. Mean static pressure distribution along the top wall of the
diffuser for Pe/P0=0.82.
-
Total Pressure ratios at the exit:
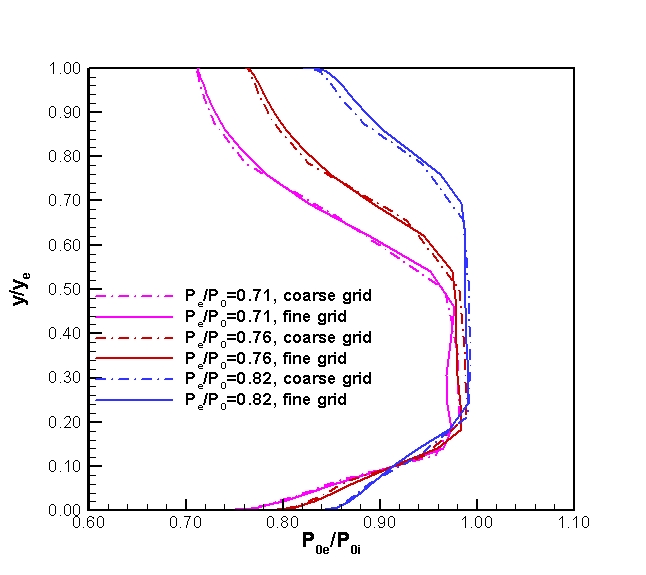
Figure 7. Total pressure ratios at the exit station of the diffuser.
Some Issues about the calculation of
the diffuser efficiency n_d:
-
non-uniform flow at the exit (flow properties not constant
in y). This may require an integral approach.
for example,
Isentropic Efficiency for diffusers (from Hill and Peterson) is defined
by:

where  is the
entalphy at the state that would be reached by isentropic compression to
the actual stagnation pressure at the exit.
Since we have non-uniform flow at the exit, a modified approach may be:

where


In
the above integral  can be written as (by using the isentropic relation):

-
The method used for numerical integration may effect the
result.
-
In our case, the duct does not actually reflect the characteristics
of a typical diffuser if we consider the whole geometry. ( In most cases,
exit velocity is bigger than the inlet velocity). This may give some unrealistic
diffuser efficiencies. However, as an alternative, we may consider the
throat conditions as the inlet.
is the
entalphy at the state that would be reached by isentropic compression to
the actual stagnation pressure at the exit.
can be written as (by using the isentropic relation):