DEPARTMENT OF AEROSPACE AND OCEAN ENGINEERINGSpatial Correlation Data of the Fluctuating Wall-Normal-Velocity |
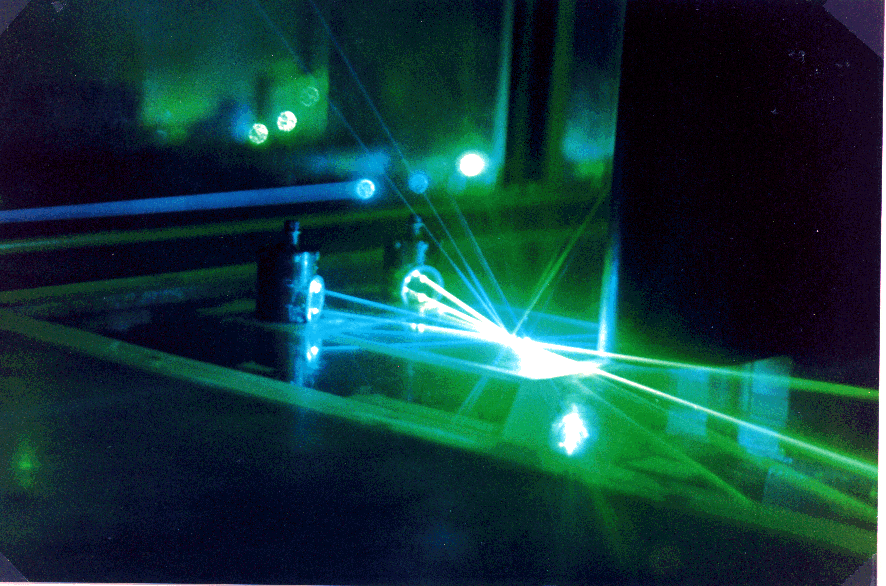
The laser-Doppler velocimeter probes used for the present measurements.
For clarity,
the probes are shown here without the aerodynamic shrouds that are
used while acquiring
data in order to alleviate any flow disturbances caused by the presence
of the probe heads.
Favorable comparisons with direct numerical simulation (DNS) results in the near-wall region of the two-dimensional flow validate the experimental techniques used here. For a given fixed probe, non-dimensional correlation values scale best on the non-dimensional probe separation. For both the 2-D and 3-D cases, the shift in the location of peak correlation proceeding downstream suggests the existence of an outgoing characteristic line that is only affected by the upstream flow. The correlation coefficient decays more rapidly as the probe separation increases near the wall when compared to the decay of the correlation coefficient away from the wall, relative to the fixed probe location.
The variation of the spatial correlation with probe separation in the 3-D flow is similar to the variation in a 2-D flow, except that decay of the correlation with probe separation is slower in the 3-D flow. The spanwise variation of the correlation coefficient is symmetric about the fixed probe location for the 2-D case, as dictated by reciprocity. However, the 3-D case exhibits a large asymmetry for a middle range of spanwise probe separations. The correlation with larger spanwise probe separations are more symmetric. In general, at a given distance from the wall, the maximum correlation is skewed toward a non-zero spanwise probe separation. Additionally, the skewing of the correlation coefficient in the spanwise direction tracks the sign of (w3-bar).
XPROF.EXE (129 KB): Contains 196 files that occupy 324 KB when uncompressed
Contains profiles that show the variation of the correlation coefficient with streamwise probe separation within a particular spanwise plane and at a particular distance from the wall.
YPROF.EXE (398 KB): Contains 398 files that occupy 1.2 MB when uncompressed
Contains profiles that show the variation of the correlation coefficient with wall-normal probe separation within a particular spanwise plane and at a particular streamwise measurement station. This zip file contains the most complete version of the data set.
ZPROF.EXE (116 KB): Contains 116 files that occupy 307 KB when uncompressed
Contains profiles that show the variation of the correlation coefficient with spanwise probe separation at a particular streamwise measurement station and at a particular distance from the wall.